
1.95B
newsletter sends analyzed
72,885
deployments
Overview of what the first half of 2026 told us
Across a broad cross-section of media publishers sending newsletters on the Omeda platform, engagement stayed remarkably steady through the first half of 2026 — and who a newsletter reaches drove engagement far more than how many it reaches.
2.2x
Consumer media engagement runs about double
Consumer & enthusiast (B2C) newsletters see roughly twice the click-to-open rate of B2B titles, and nearly triple the overall click rate — the clearest pattern in the data.
Flat
Engagement held all 6 months
Click-to-open rate barely moved month to month. Readers who open keep clicking at a steady rate.
~40%
Complaints fell after January
Spam complaints dropped by roughly 40% from January to June as post-holiday list churn cleared — deliverability stayed clean throughout.
How a typical newsletter performed
Median values across all publishers in the study, with the typical range (middle 50%) most programs fall into — a useful yardstick for any single newsletter operation.
| Metric | Typical (median) | Most programs fall in |
|---|---|---|
| Open rate | 31.6% | 24.6–38.5% |
| Click rate (CTR) | 1.16% | 0.6–2.0% |
| Click-to-open rate (CTOR) | 3.8% | 2.3–5.8% |
| Unsubscribe rate | 0.09% | 0.05–0.13% |
| Spam-complaint rate | 0.002% | 0.001–0.004% |
Rates are calculated per delivered email and summarized per publisher, so one very large sender can’t dominate the benchmark. CTOR and CTR are the most reliable comparison points — open rates are inflated industry-wide by automated inbox activity.
B2B vs. Consumer newsletters
Splitting the newsletter sends into B2B media (trade and professional titles) and Consumer / Enthusiast publishers (B2C) reveals a consistent, sizable engagement gap on every positive metric.
| Metric | B2B media | Consumer / Enthusiast | B2C vs. B2B |
|---|---|---|---|
| Open rate | 30.9% | 40.2% | +9.3 pts |
| Click rate (CTR) | 1.01% | 2.86% | 2.8× |
| Click-to-open rate (CTOR) | 3.4% | 7.6% | 2.2× |
| Unsubscribe rate | 0.088% | 0.112% | +0.02 pts |
Median per publisher. B2C leads on all three engagement metrics; the only place B2B comes out ahead is a marginally lower unsubscribe rate.

Consumer & enthusiast audiences deliver about twice the click-to-open rate (2.2×) and nearly triple the click rate (2.8×) of B2B — and open about 9 points more often.
The gap makes intuitive sense: enthusiast and consumer readers opt into topics they care about personally, while B2B newsletters are read in a busier professional context. The trade-off is modest — consumer lists unsubscribe slightly more often — but complaint rates stay very low across both groups.
Engagement holds; deliverability stays clean
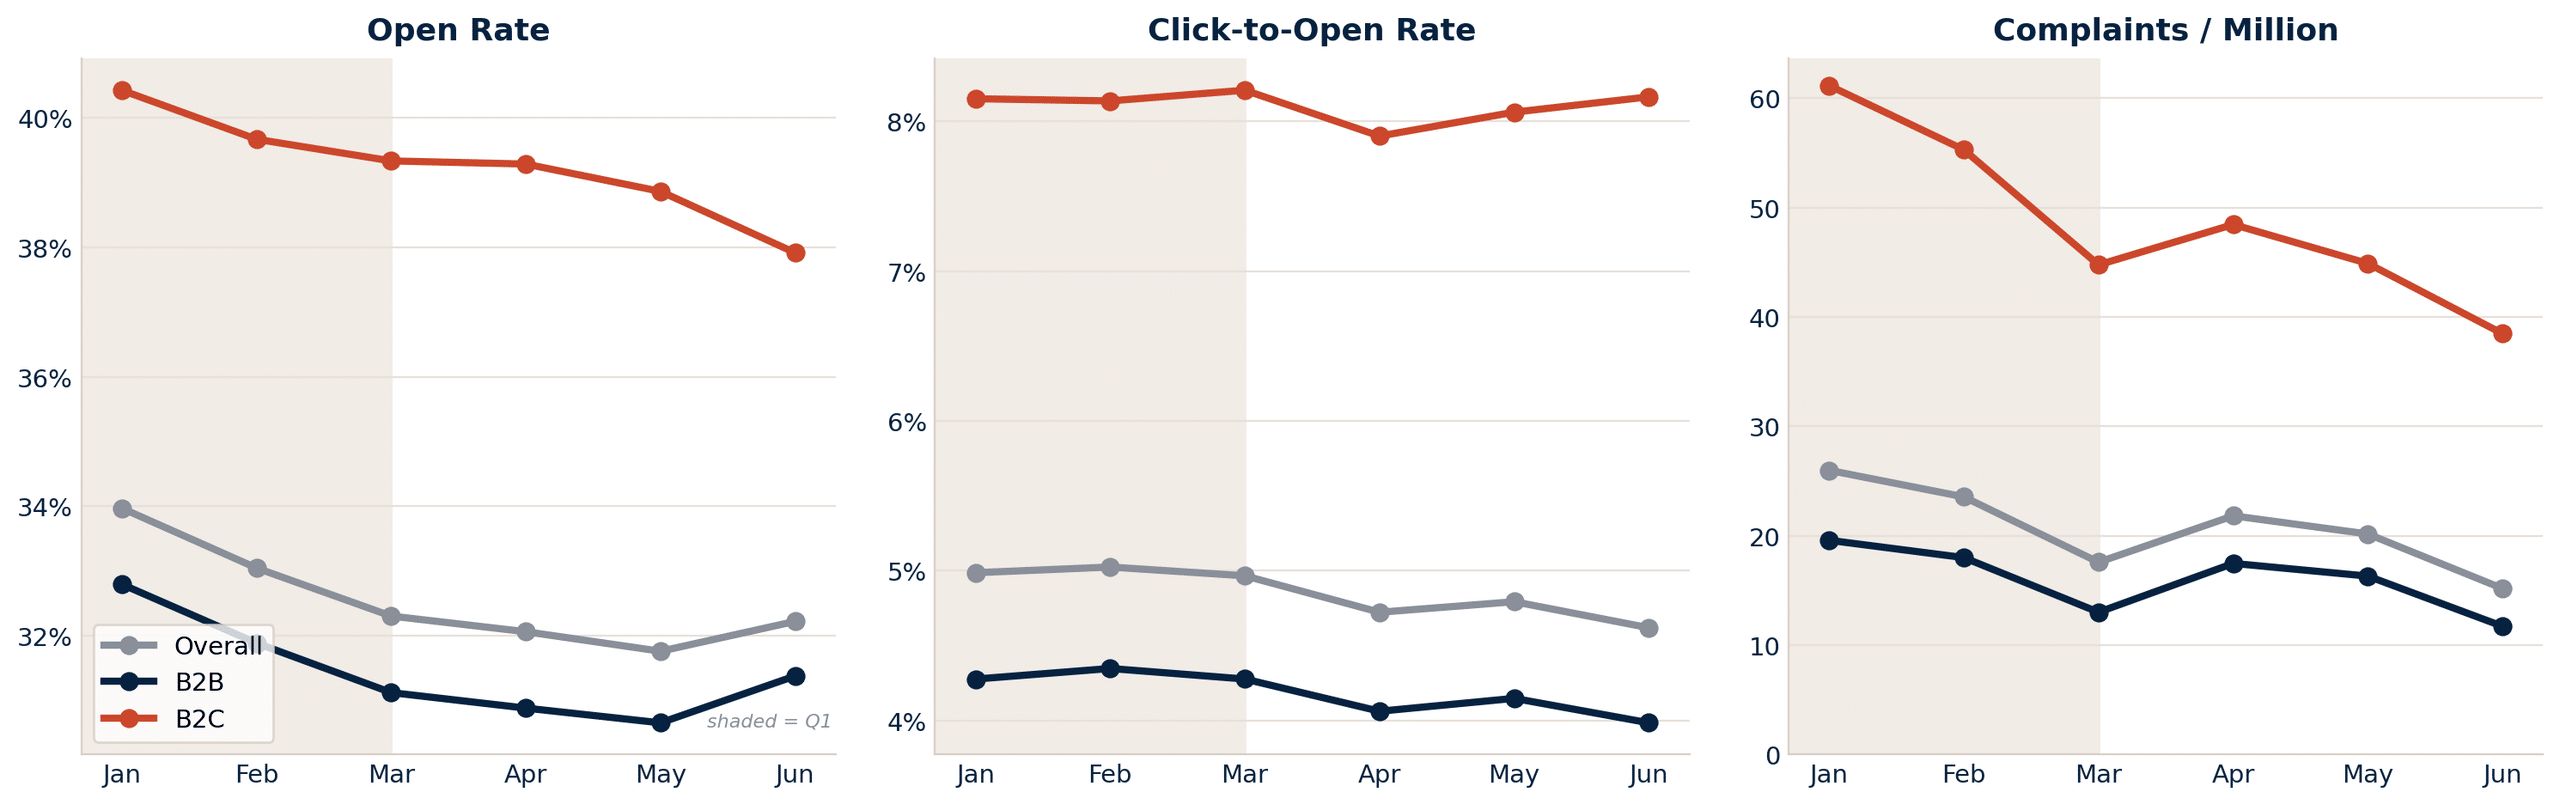
Tracked month by month across the half, the story is consistency. Open rates softened gently early in the year and then leveled off; click-to-open held flat; complaints declined from a January peak.
Month over month — all publishers
| Month | Open | CTR | CTOR | Unsub | Complaints/M |
| Jan | 34.0% | 1.69% | 5.0% | 0.112% | 26 |
| Feb | 33.0% | 1.66% | 5.0% | 0.101% | 24 |
| Mar | 32.3% | 1.60% | 5.0% | 0.077% | 18 |
| Apr | 32.1% | 1.51% | 4.7% | 0.089% | 22 |
| May | 31.8% | 1.52% | 4.8% | 0.086% | 20 |
| Jun | 32.2% | 1.49% | 4.6% | 0.072% | 15 |
Month over month — B2B media
| Month | Open | CTR | CTOR | Unsub | Complaints/M |
| Jan | 32.8% | 1.40% | 4.3% | 0.100% | 20 |
| Feb | 31.9% | 1.39% | 4.3% | 0.091% | 18 |
| Mar | 31.1% | 1.33% | 4.3% | 0.071% | 13 |
| Apr | 30.9% | 1.25% | 4.1% | 0.082% | 17 |
| May | 30.6% | 1.27% | 4.1% | 0.078% | 16 |
| Jun | 31.4% | 1.25% | 4.0% | 0.066% | 12 |
Month over month — Consumer / Enthusiast (B2C)
| Month | Open | CTR | CTOR | Unsub | Complaints/M |
| Jan | 40.4% | 3.30% | 8.2% | 0.180% | 61 |
| Feb | 39.7% | 3.23% | 8.1% | 0.154% | 55 |
| Mar | 39.3% | 3.23% | 8.2% | 0.115% | 45 |
| Apr | 39.3% | 3.10% | 7.9% | 0.134% | 48 |
| May | 38.9% | 3.13% | 8.1% | 0.134% | 45 |
| Jun | 37.9% | 3.10% | 8.2% | 0.110% | 38 |
Volume-weighted across all newsletter sends each month. Both segments track the same shape: a gentle open-rate softening that levels off, a flat CTOR, and steadily declining complaints after January.
The January-high, then-declining churn pattern is consistent with routine post-holiday list cleanup settling out. Because click-to-open stayed flat even as open rates dipped, the softening looks like measurement and inbox drift rather than genuine audience fatigue.
Takeaways for publishers
- Audience relationship beats reach. Engagement tracked audience type, not list size. Focused niche and enthusiast lists matched — and on clicks, outperformed — far larger senders.
- Judge health by clicks, not opens. Click-to-open rate is the steady, trustworthy signal. Treat open rate as directional given industry-wide inflation from automated opens. Learn more about email click bots and their affect on engagement metrics.
- Volume didn’t burn audiences. Higher-cadence programs kept complaint rates low — often lower than smaller senders — evidence of mature list hygiene, not fatigue.
- Expect a January churn bump. Unsubscribes and complaints ran highest in January and settled through the half. Plan re-engagement and list hygiene around it.
Methodology
Scope. Aggregated, anonymized newsletter-designated email sent through Omeda by a broad cross-section of media publishers between January and June 31, 2026 — 1.95 billion sends across 72,885 deployments. Only email designated “Newsletter” is included; promotional and transactional sends are excluded. Interested in other email types and how they perform? Check out our latest email engagement benchmark report.
Segments. Publishers were classified as B2B media (trade, professional and industry titles) or Consumer / Enthusiast (B2C). Publishers serving mixed audiences were assigned to their predominant readership.
Method. Rates are computed against delivered email. Each publisher contributes one figure per metric, and benchmarks report the median across publishers plus the interquartile (middle-50%) range, so results reflect the typical program rather than the largest senders. Open-rate figures are affected by automated inbox activity industry-wide and are best read alongside click-based metrics.
