Email Engagement Report – Q2 2022
Intro
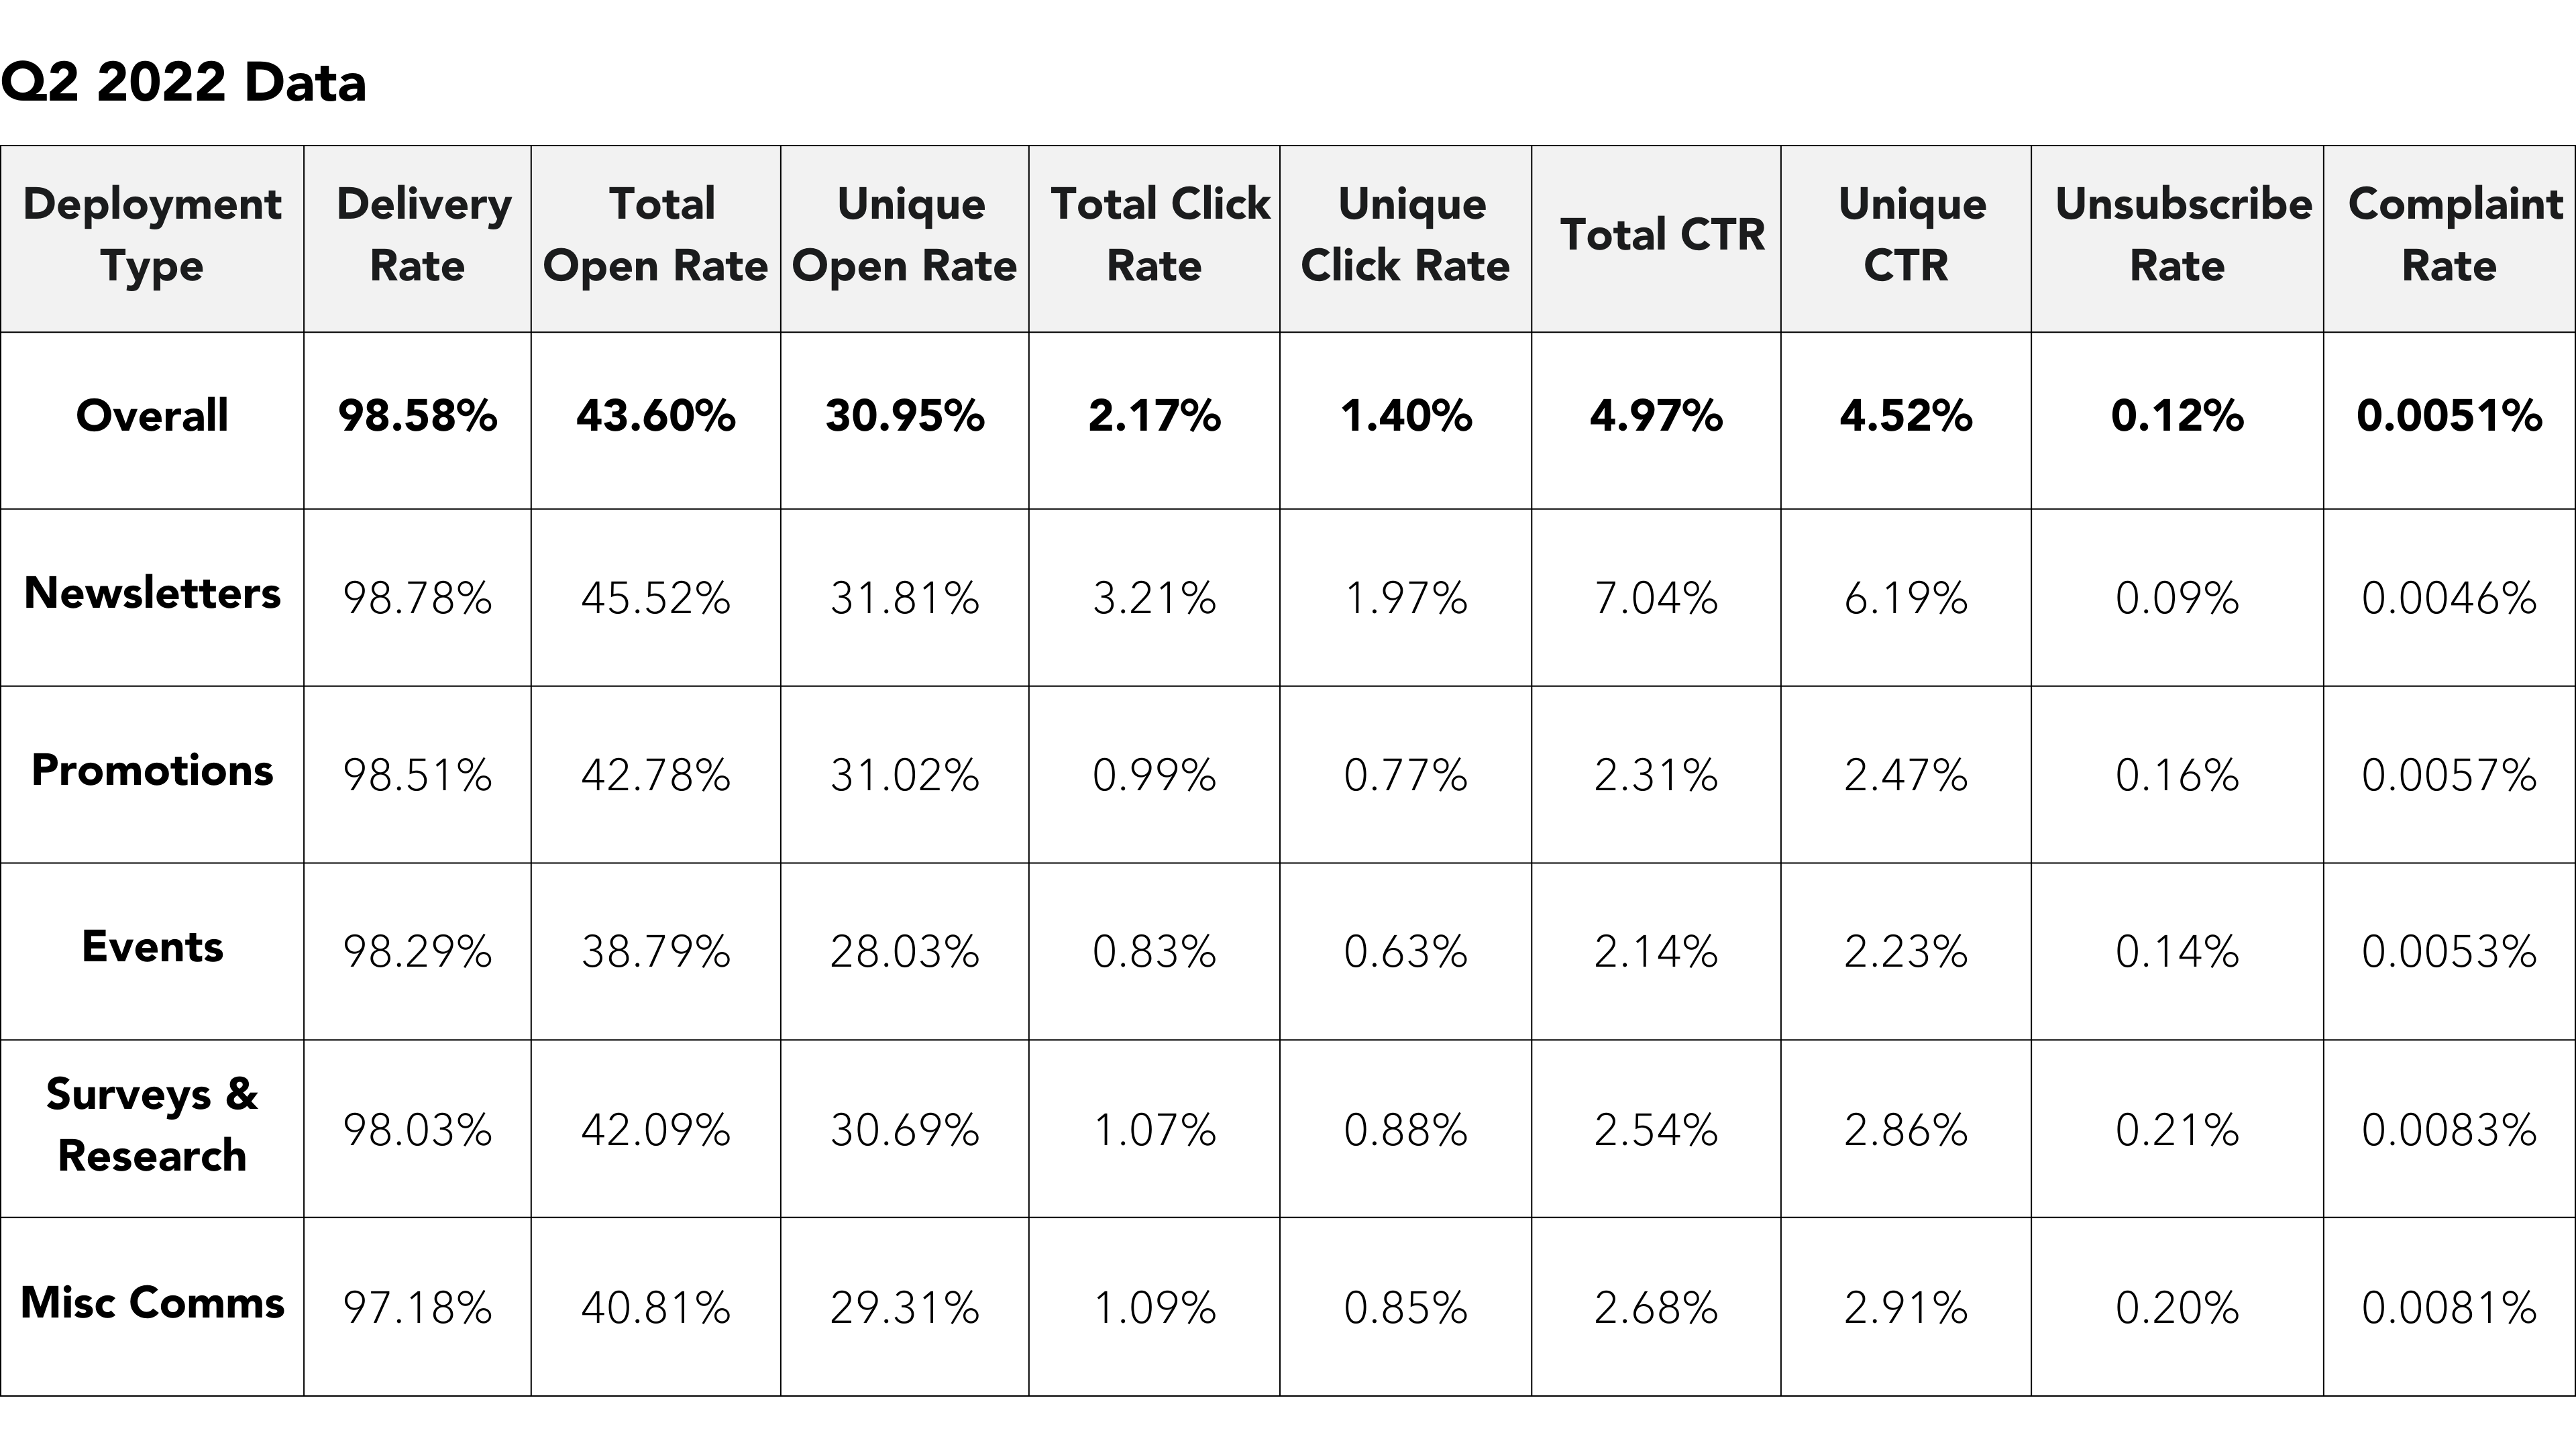
Every quarter, we gather email deliverability and engagement statistics from Omeda clients into a single report. This new report analyzes data from over 7.8 billion emails sent from Q2 2021 through Q2 2022, looking at deliverability, open rates, click rates, unsubscribes and complaints. We also segment the data by deployment type – newsletters, promotions, surveys, and more – to better see how these individual sends perform against the average.
Since publishing our Q1 report in April, we’re seeing open rates level off, signaling the disruption caused by iOS15 and Apple Mail Privacy Protection (MPP) may be stabilizing. In this new report, we’re also sharing which day of the week is best to send an email (based on type), as well as which subject line lengths are most successful.
Overall Comparison
Formula Reference
Delivery Rate = Delivery / Sent
Total Open Rate = Total Opens / Delivered
Unique Open Rate = Unique Opens / Delivered
Total Click Rate = Total Clicks / Delivered
Unique Click Rate = Unique Clicks / Delivered
Total CTR = Total Clicks / Total Opens
Unique CTR = Unique Clicks / Unique Opens
Unsubscribe Rate = Unsubscribes / Delivered
Complaint Rate = Complaints / Delivered
How much are open rates leveling off?
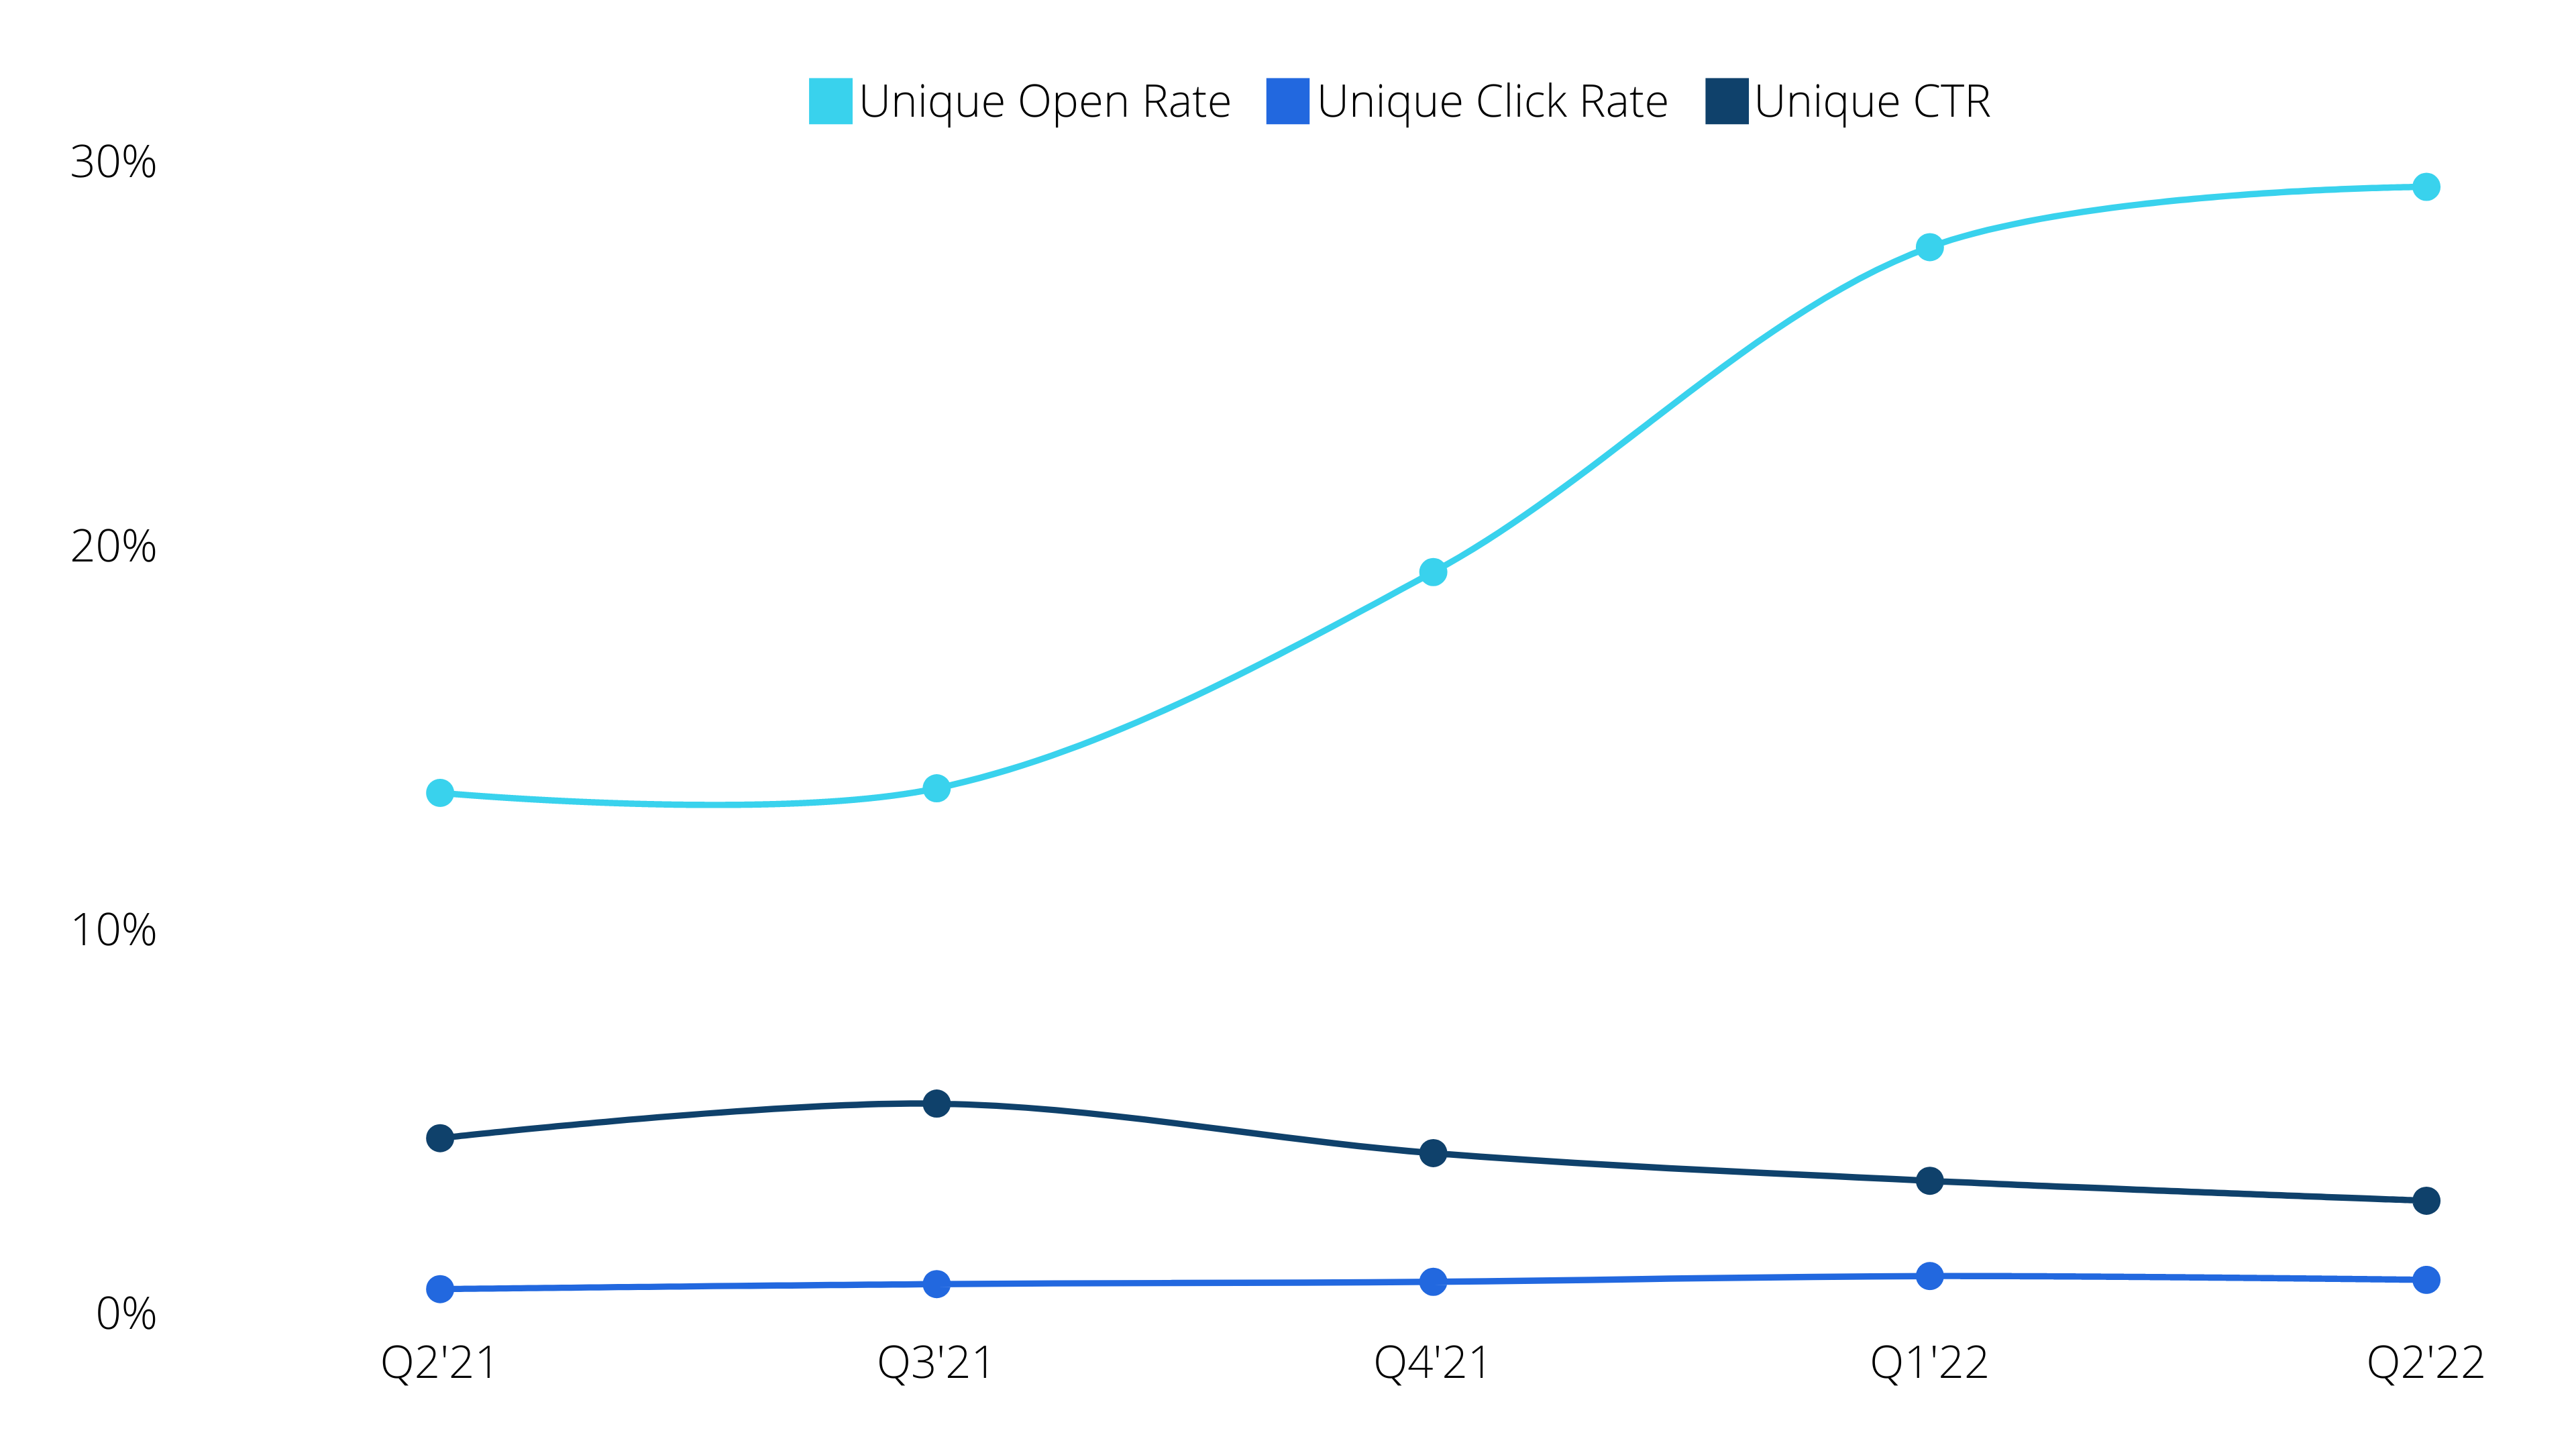
While open rates continue to climb and click through rates proportionally decline, the changes are not as drastic as previous quarters following the release of Apple’s MPP just prior to Q4 2021.
For Q2 2022, we saw a 6.59% increase in unique open rate quarter-over-quarter, compared to a 36.6% increase in Q1 2022 and a 39.1% increase Q4 2021.
Similarly, click through rates have decreased 16.5% in Q2 2022, down from a decrease of 18.9% in Q1 2022.
The graph below illustrates how metrics are trending for overall deployments from Q2 2021 through Q2 2022. Note that Apple MPP was released in late Q3 2021.

Want to know more about the background and impact of Apple’s iOS 15 MPP release? Check out our analysis comparing email data directly before and after MPP was released. Although open rates appear to be leveling off recently, we do strongly recommend using click rate (not open rate) as a primary signal of email engagement.
Performance by Deployment Type
Newsletters
(Includes digital magazines & newsletters)
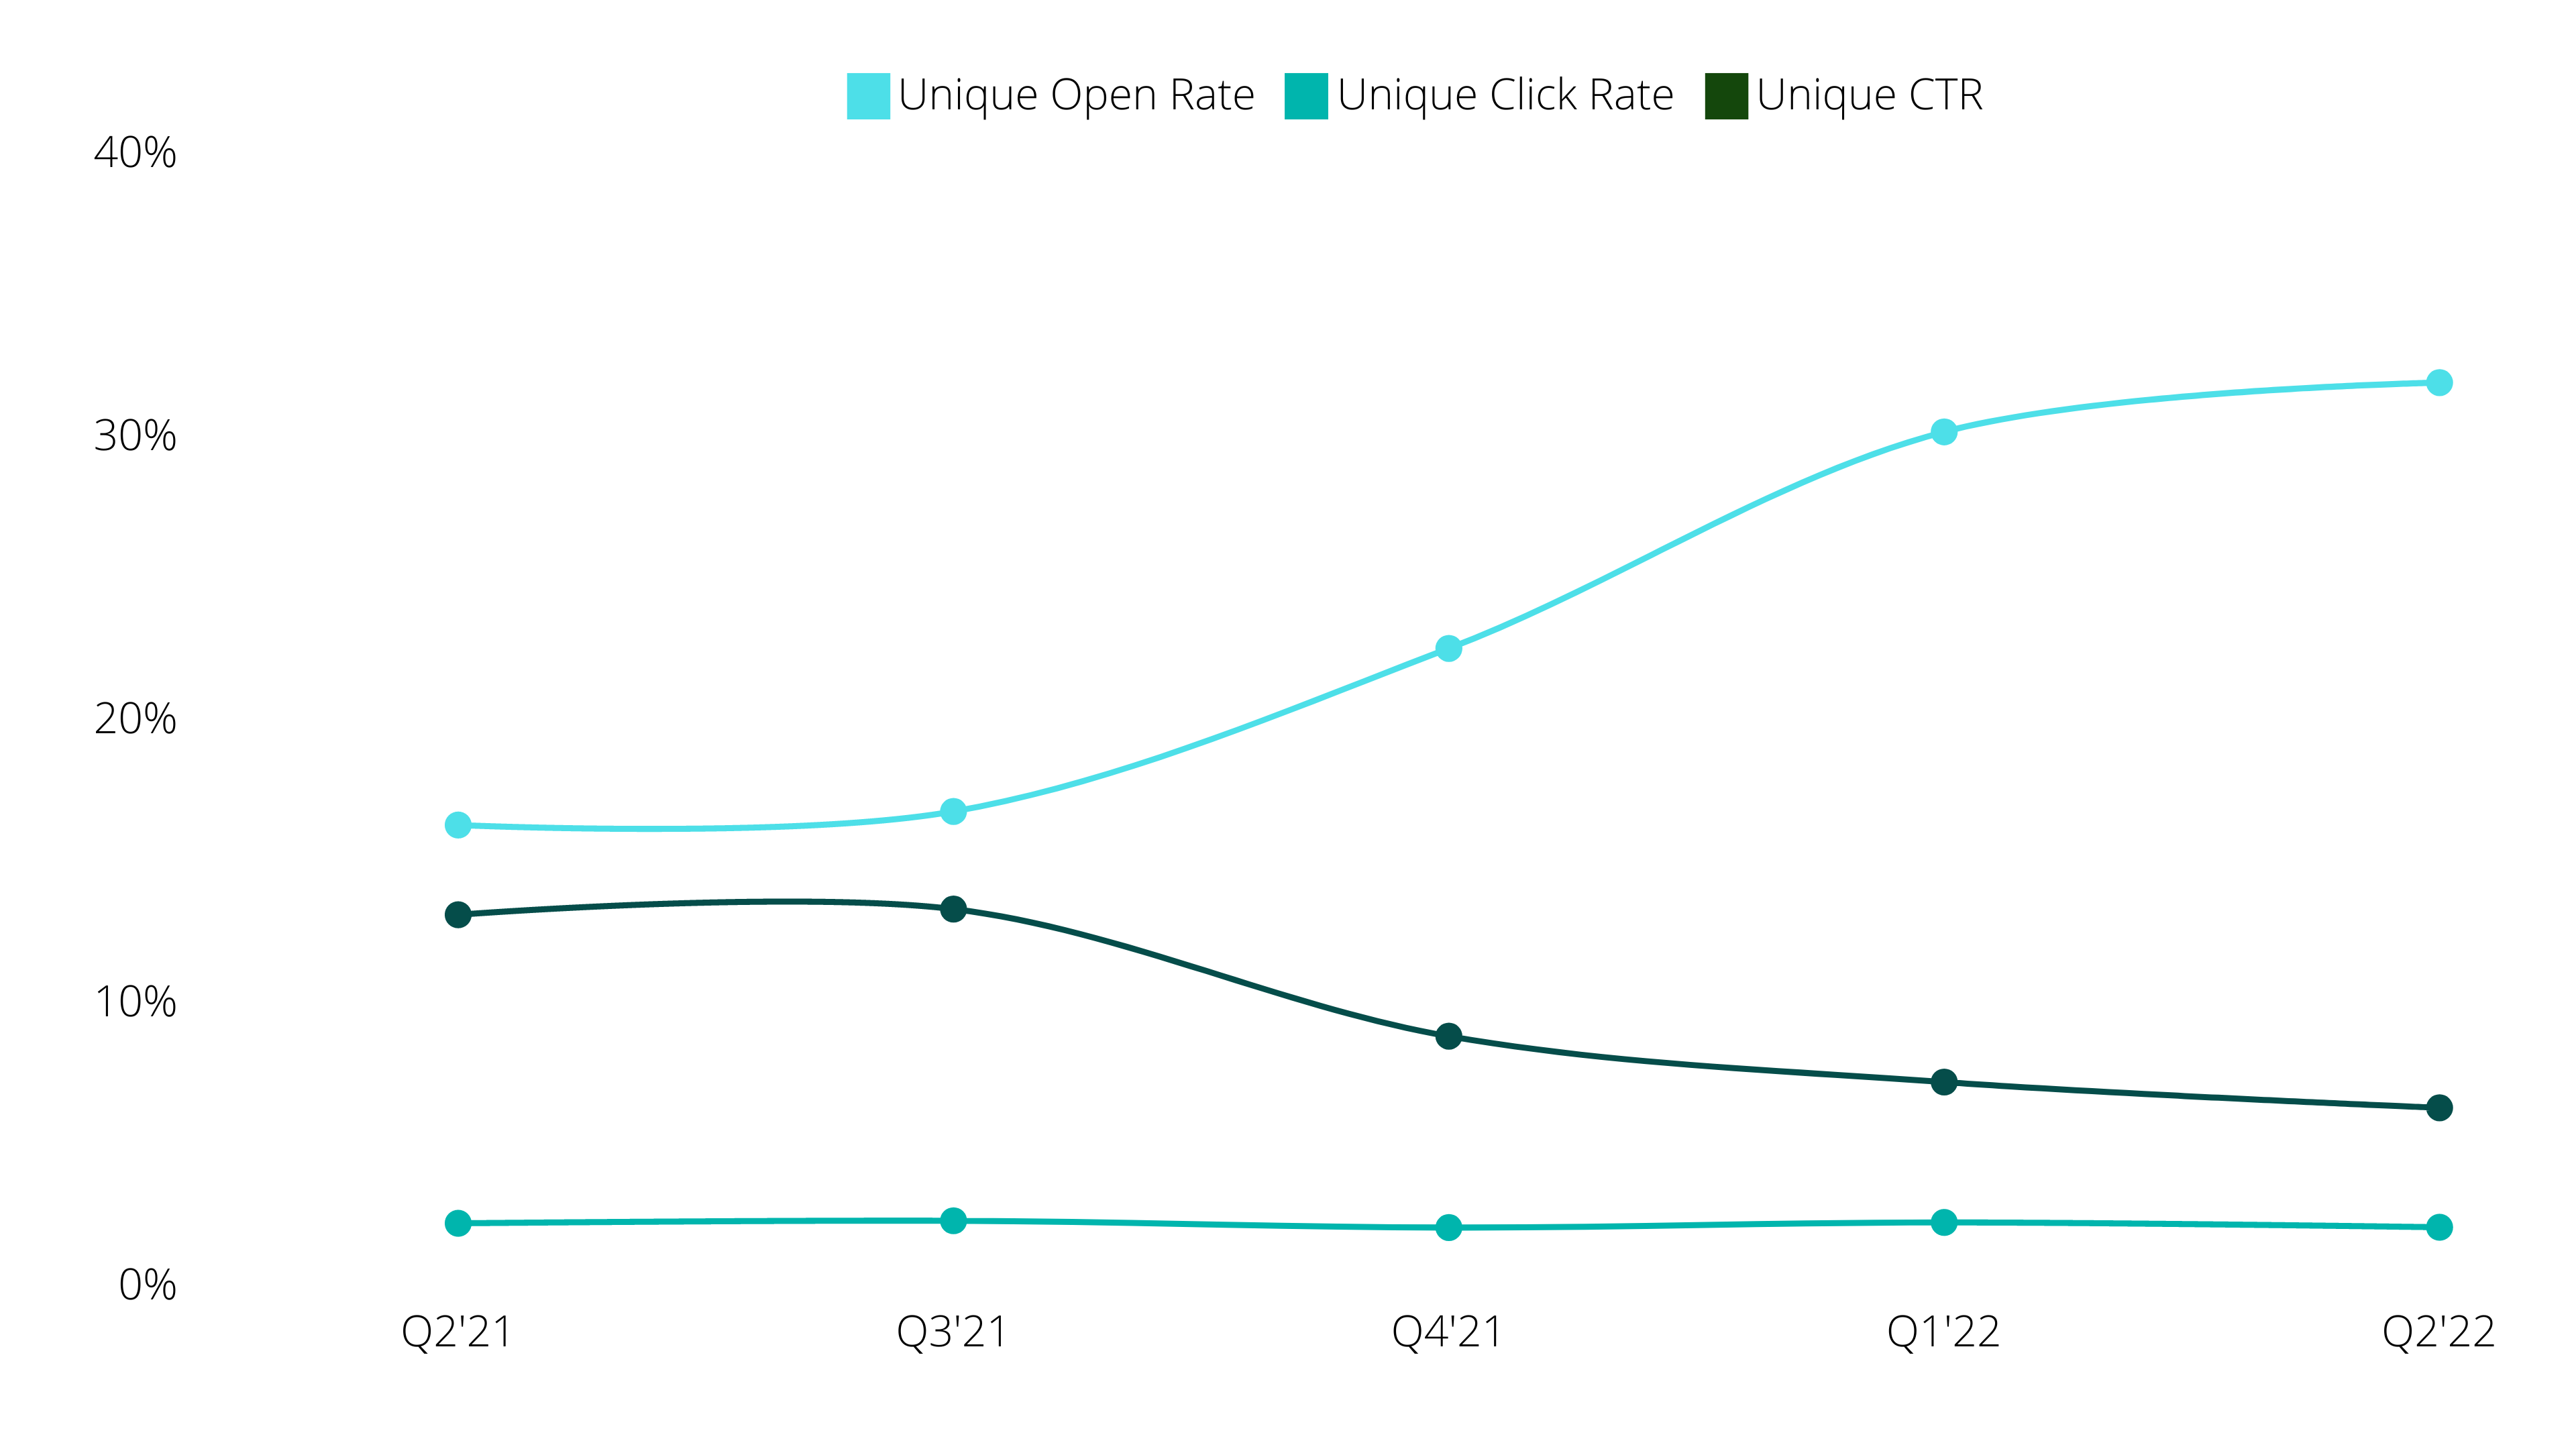
Unique Open Rate: 31.81% | Unique Click Rate: 1.97% | Unique CTR: 6.19%
Promotions
(Includes advertiser promotion, audience promotion, marketing, third party and white papers)
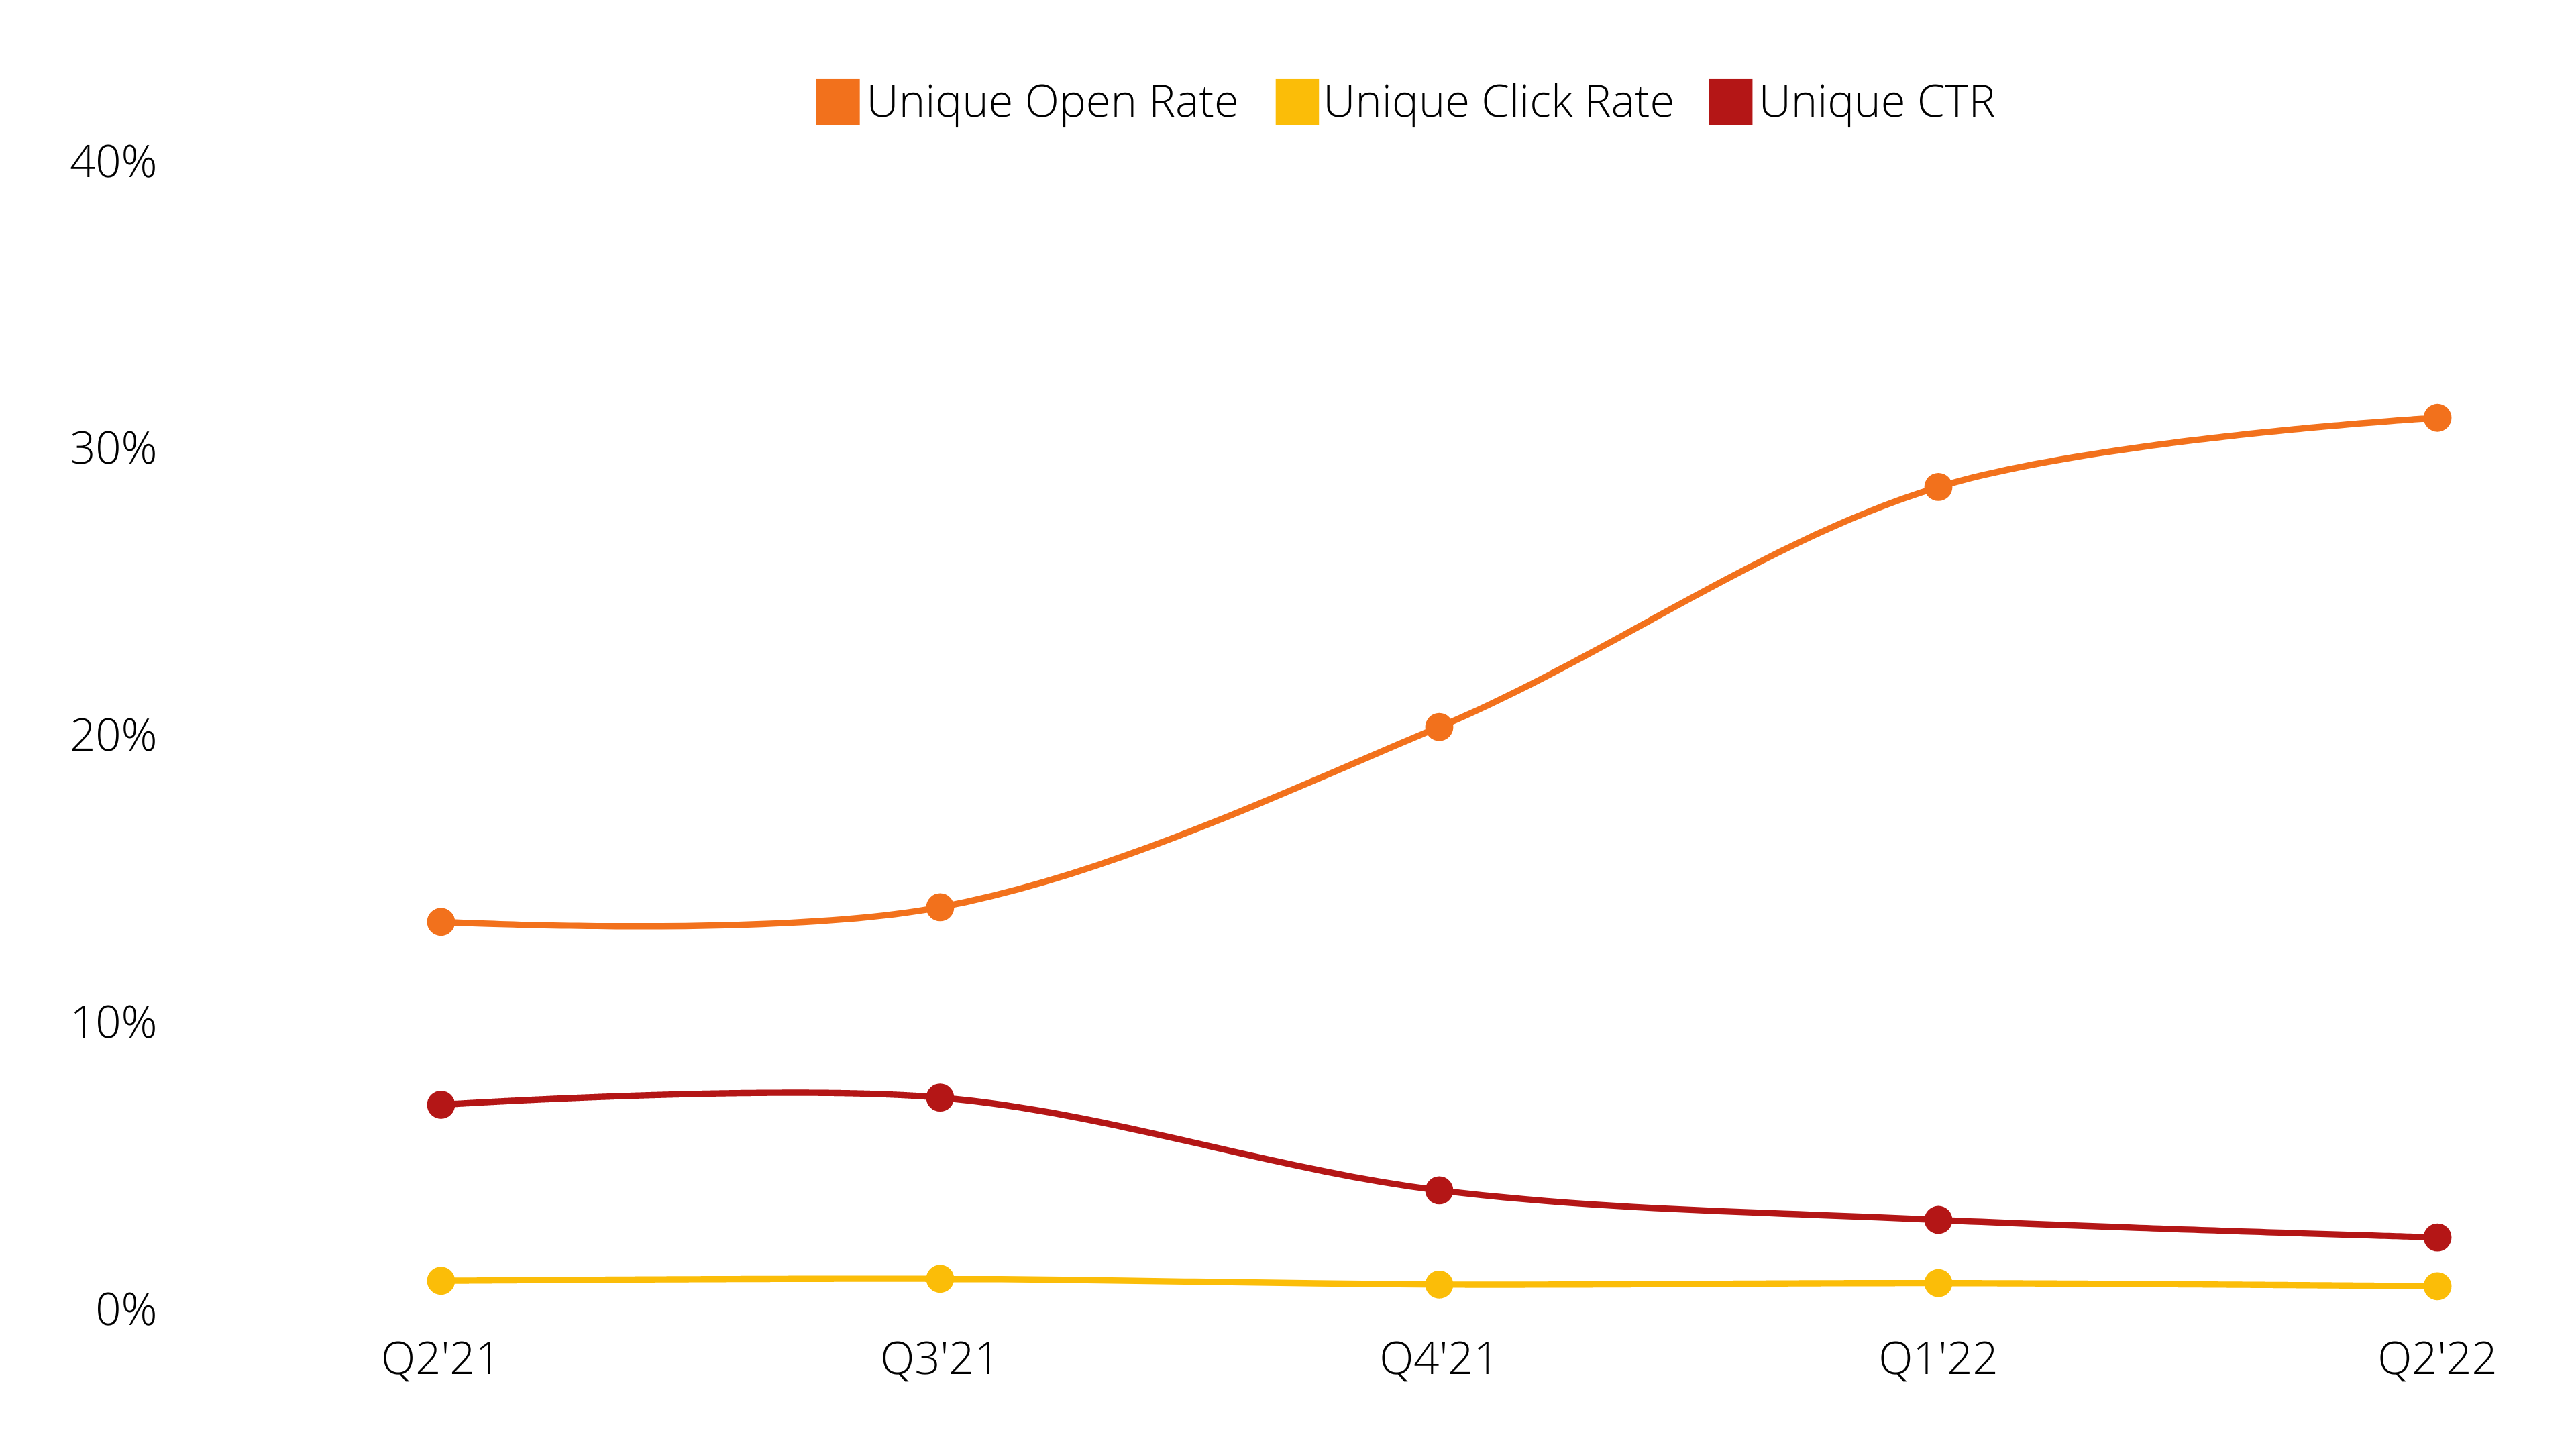
Unique Open Rate: 31.02% | Unique Click Rate: 0.77% | Unique CTR: 2.47%
Events
(Includes events, live conferences, virtual conferences and webinars)
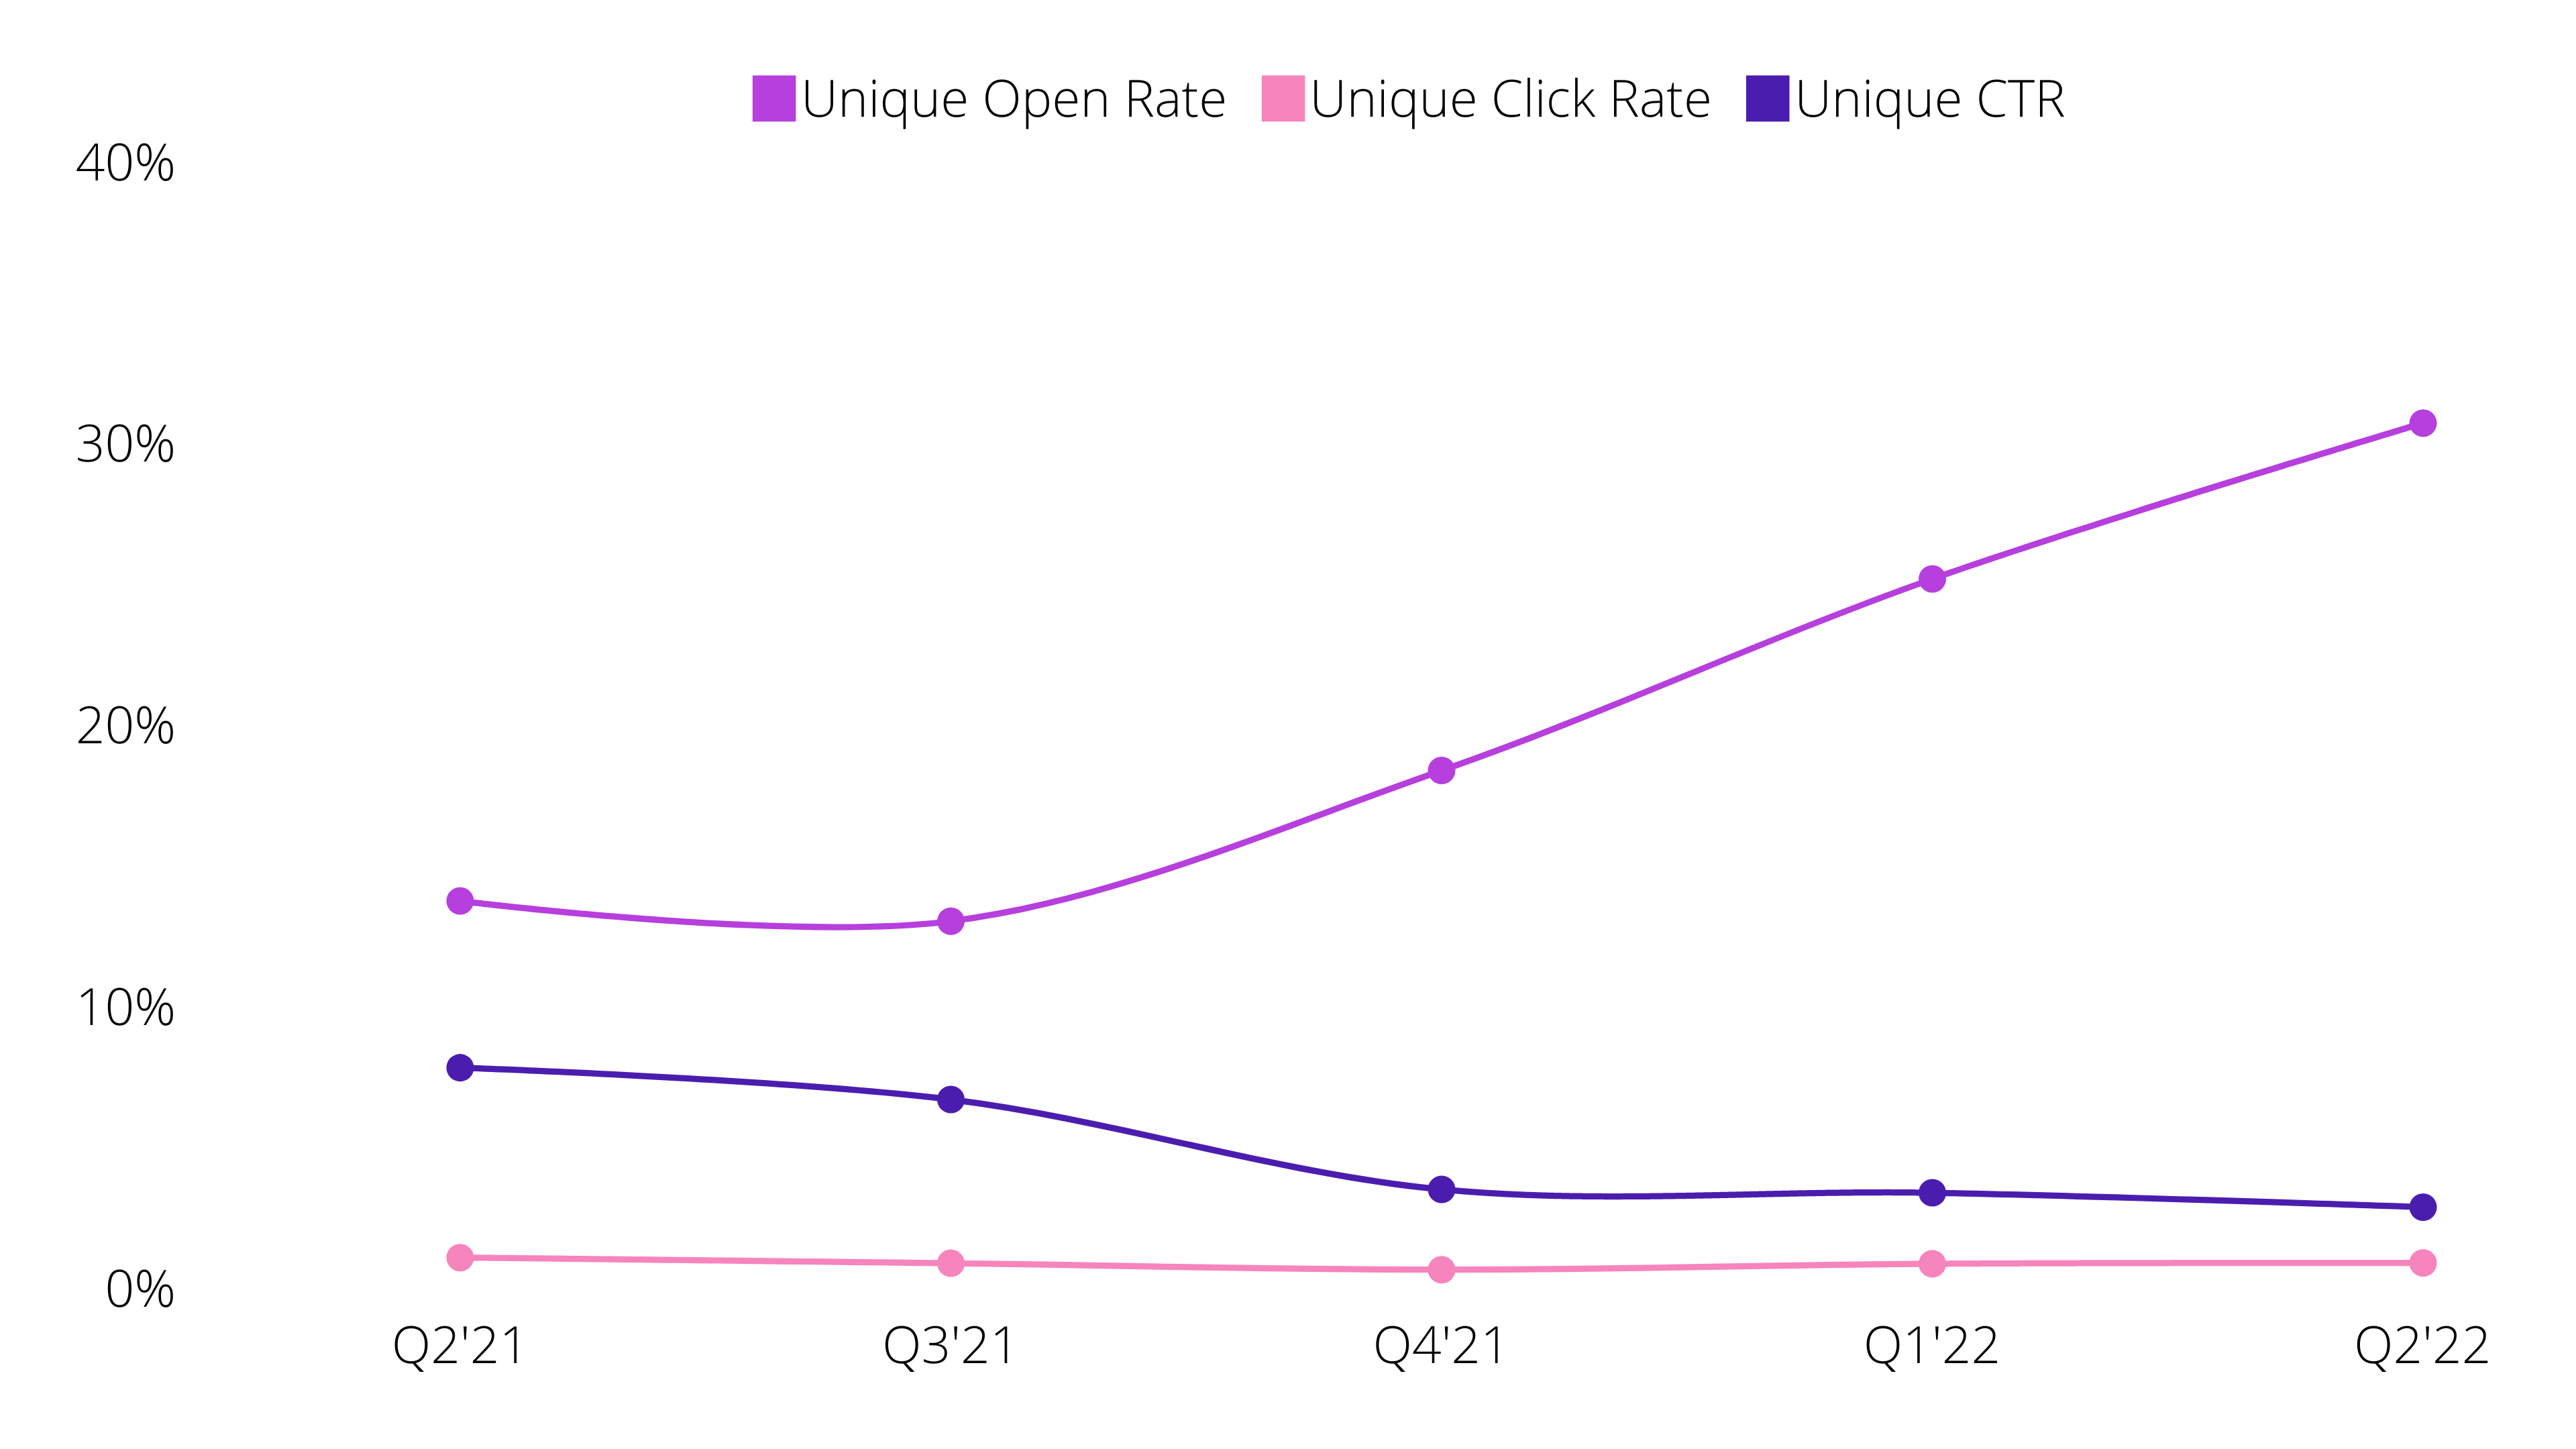
Unique Open Rate: 28.03% | Unique Click Rate: 0.63% | Unique CTR: 2.23%

Surveys & Research
(Includes reader service, research and surveys)
Unique Open Rate: 30.69% | Unique Click Rate: 0.88% | Unique CTR: 2.86%
Miscellanous Communications
(Includes any communications that don’t fit into the other deployment categories)
Unique Open Rate: 29.31% | Unique Click Rate: 0.85% | Unique CTR: 2.91%
Clickbots and how we handle them
With the volatility seen in these email metrics, it’s easy to feel a little annoyed at the lack of clarity in email performance. Fortunately, Omeda provides native functionality to make sure your click performance is portrayed as accurately as possible.
Omeda looks for 10 markers of clickbots and automatically removes them from reports (and offending clicks can be viewed separately). The chart below outlines the 10 markers we look for and which clicks we remove.
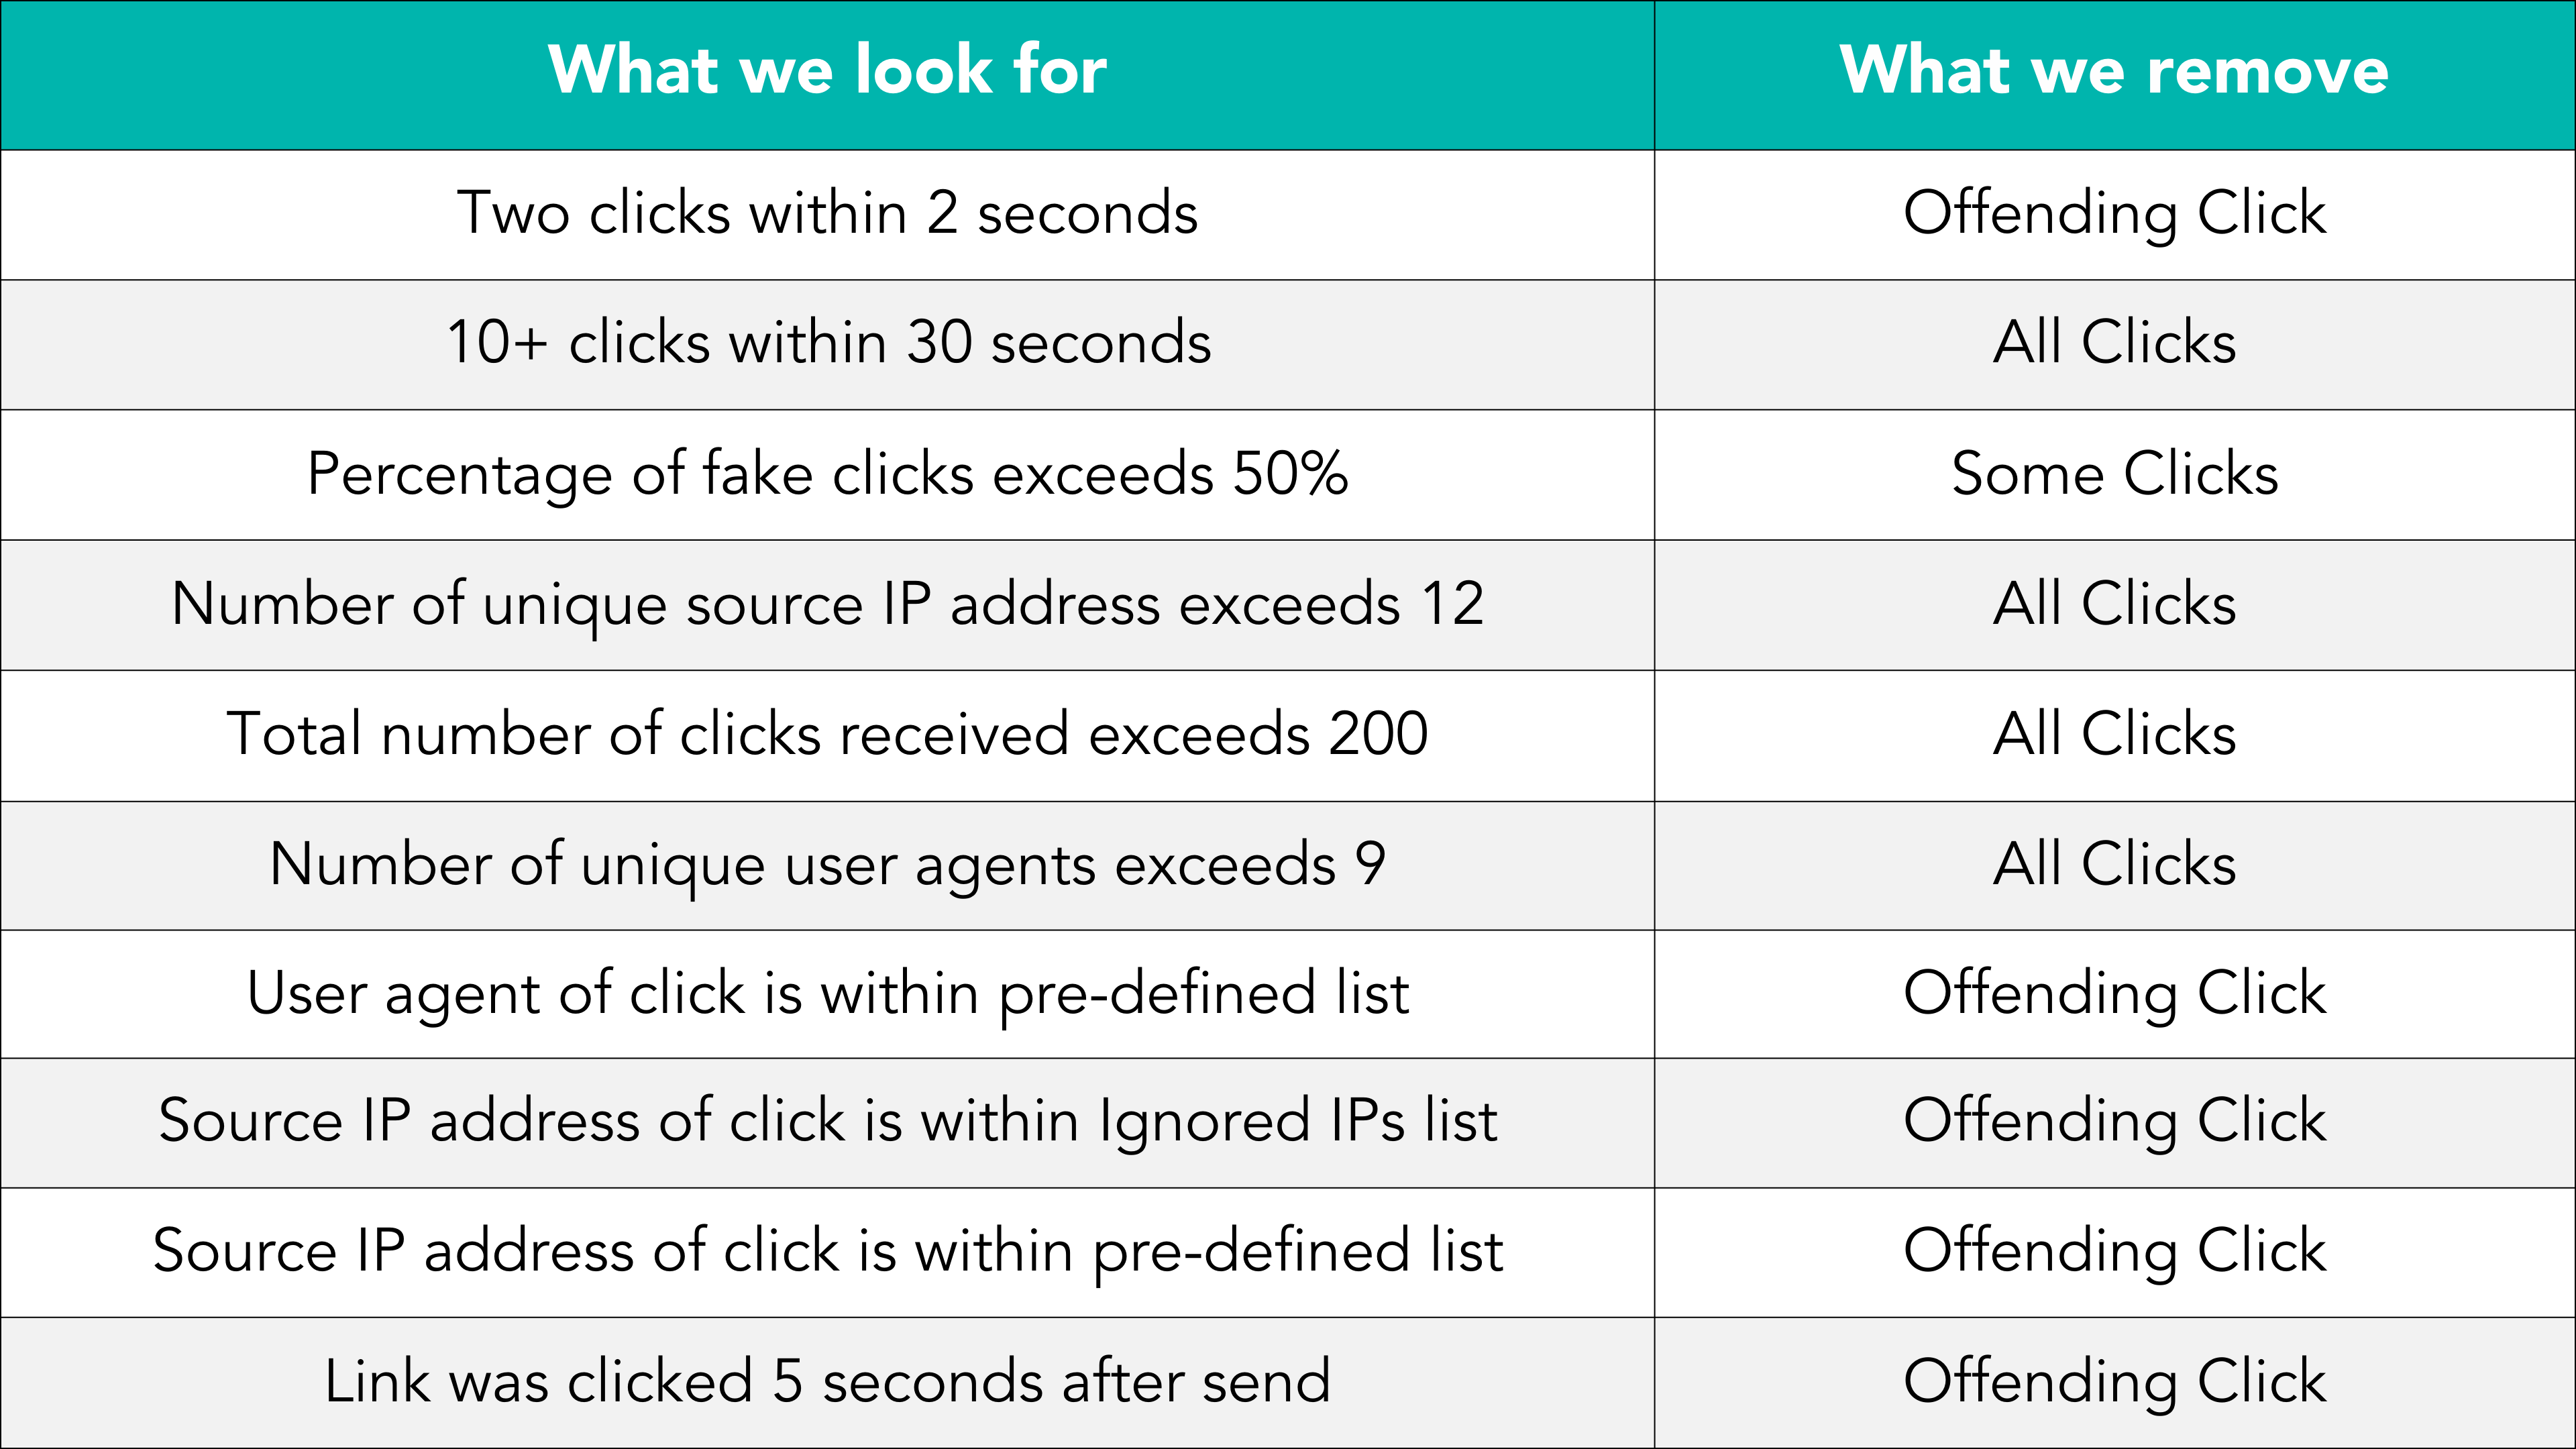
On average, Omeda removes 65% of clicks from email reports. We’re always reviewing suspicious clicks and ensuring our algorithms are updated to include new types of clickbots.
Want to learn more about clickbots? Check out our blog post, Click Bots: The Good, the Bad and the Ugly Truth, and review this document from M3AAWG (Messaging Malware Mobile Anti-Abuse Working Group) for guidance on the way that non-human interactions (NHI) impact performance metrics.
Email Performance Tips
Day of Week
Given the sheer amount of data – all 7.8 billion emails and their individual performance metrics – in our database, we break down what it takes to get the best performance out of each send. This matrix compares each type of send along with the top click rate by day (thanks to our data master, Harold, for pulling this report together!).

Subject Line Length
We looked at over 136,000 email campaigns covering over 3.9 billion emails delivered. The most successful subject line length, with a 43% open rate, was 15 characters. This has one big caveat: most was from one client who was consistent with the time of their sends, only sent to opt-ins, and sent content that was pertinent to their audience. We’ve removed this star client’s deployments from the below dataset, but you can still see that shorter is better.
The Omeda marketing team tested this theory. We wondered if longer, more detailed subject lines would pique interest over shorter, bland ones for our newsletter. In the end, our winning subject line was “Omeda Newsletter” – beating out every phrase and all the top subject line keywords we tested. In the end, after testing longer and shorter phrases on other types of emails, what we found is simple: subject lines that are short, concise and specific are most successful.
The data in the chart below shows that open rates start to go back up in the 175-224 character range, though not to the level of subject lines that are less than 20 characters. We recommend testing different lengths to see what resonates with your audience. When running your own subject line tests, keep in mind that most email clients only show part of the subject line, often just a dozen characters. It’s also important to optimize your subject lines for mobile viewing, especially when most mobile apps will only display about 30 characters of your subject line. Hypothesize accordingly and A/B test as much as you can.

Test for Success
A lot of success can boil down to two factors: which day of week to send an email and the best length for a subject line. As always, test send days and subject lines yourself – and if you haven’t been sending your marketing emails on Wednesday or your webinar emails on Friday, definitely try switching things up.
Another way to find success? Only send to opt-ins. By focusing on segments who actively chose to receive your content, you ensure your metrics will always beat our benchmarks.
Conclusion (TL;DR version)
There are many reasons to be wary of (and confused about!) email statistics these days. From Apple MPP’s disruption to open rates to Google’s recent decision to postpone the removal of third-party cookies to clickbot volatility, it’s a lot to keep track of. Not to mention the increased demand for privacy and new data privacy laws. All of these combined shines a bright light on the importance of prioritizing a strong first-party data strategy.
Email continues to be a force, and with a few tricks to test out and some diligence, you can optimize performance over time. Plus, when your audience strategy is built on a foundation of first-party data, you’ll be well-prepared for future changes.
For more on why first-party data is so valuable moving forward and tips to get started, check out our guide, And the Winner is…First-Party Data, Your Guide to First-Party Data as the Third-Party Cookie Crumbles.